
Planning & Development
Press Release
Vision Zero 2022 Annual Report Shows Decrease in Total Crash Fatalities
Interactive Vision Zero Crash Dashboard provides sortable quarterly data from first half of 2023
August 9, 2023 -- Mayor Sylvester Turner announced that crashes, fatalities and serious injuries decreased on Houston streets in 2022 for the first time since the Vision Zero Houston Plan was released in 2020, according to the Vision Zero 2022 Annual Report.
Vision Zero Houston is the City’s commitment to end traffic deaths and serious injuries on Houston streets by 2030. Statistics presented in the Vision Zero Annual Report are based on the TxDOT Crash Records Information System.
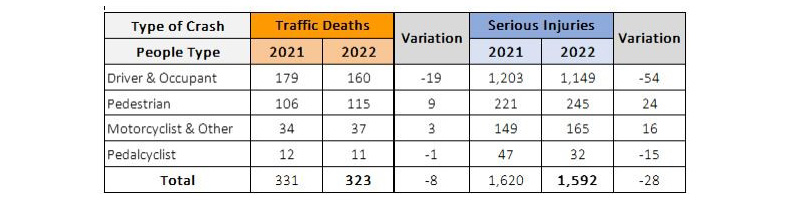
The report shows there were 8 fewer deaths and 28 fewer serious injuries in 2022 than 2021. So far in 2023, the downward trend in overall traffic fatalities across all modes of transportation is holding steady, with 36 fewer deaths in the first half of 2023 than in the first half of 2022. While fatalities and serious injuries involving pedalcyclists decreased in 2022, they are rising again in the first half of 2023.
In addition to the Vision Zero Annual Report, the Planning and Development Department also launched the Vision Zero Crash Dashboard, which provides quarterly safety data and pinpoints crashes that resulted in serious injuries and traffic deaths in an easy-to-use format with data sortable by many categories.

“The reduction in fatalities and serious injuries is encouraging, but we cannot ignore that more than 300 people died and nearly 1,600 were seriously injured in 2022 on city of Houston streets,” said Mayor Sylvester Turner. “And while overall numbers are coming down, and the number of bicyclist deaths improved in 2022, in 2023 the number of bikers killed is increasing, which is unacceptable. We are making progress, but no loss of life is acceptable.”
In 2022, drivers and occupants represented 50% of traffic deaths and 72% of serious injuries. Pedestrians represented 36% of traffic deaths and 16% of serious injuries. Motorcyclists & others represented 11% of traffic deaths and 10% of traffic deaths, while pedalcyclists represented 3% of traffic deaths and 2% of serious injuries.
Design, Implementation and Outreach
Since November 2020, Vision Zero has committed to making Houston’s transportation network safer for everyone. This past year’s work has made it clear that progress is possible, and the need is greater than ever.
During 2022, the City of Houston continued implementing the 13 priority actions plus initiated six new actions, for a total of 44 out of 50 actions underway.
- In 2021, the City of Houston identified 10 locations on the High Injury Network (HIN) to plan, design, or construct improvements aligned with Vision Zero efforts (see Figure 15). During 2022, two projects were completed, two were in construction, and six were in design.
- 20 total miles of bikeways were constructed, of which the City of Houston constructed 10 miles of on-street bike facilities.
- 6 miles of sidewalk and 214 curbs ramps were constructed.
- 30 Highway Safety Improvement Program projects were funded from 2020 and 2021 submissions, 11 of which will go into construction in 2023. Thirty-two additional projects were submitted in 2022.
- The Vision Zero team attended over 25 community events, resulting in over 3,000 people engaged during events, public speaking engagements, and in-person interactions.
Improvements in Street Safety Design
Every intersection redesigned under Vision Zero has shown improved safety metrics. Since 2014, all crashes have increased in the city of Houston by 11% and all injury or fatal crashes have increased by 2.4%. However, along segments of roadways that have had Vision Zero-aligned safety improvements that reduce conflict between road users and/or support safe vehicle speeds, the annual number of crashes with injuries has decreased by 26% and all annual crashes on those corridors have decreased by 19%. No one using a protected bike lane was killed.
- On Gray Street from Bagby Street to Hamilton Street, average annual crashes that resulted in injuries reduced by 34% and all average annual crashes reduced by 22% since the street was improved in 2019.
- On McKinney Street from Main Street to La Branch Street, average annual crashes that resulted in injuries remained the same and all average annual crashes reduced by 13% since the street was improved in 2019.
- On Austin Street from Holman Street to Commerce Street, average annual crashes that resulted in injuries reduced by 17% and all average annual crashes reduced by 15% since the street was improved in 2020.
- On Bagby Street from Clay Street to Franklin Street, average annual crashes that resulted in injuries reduced by 75% and all average annual crashes reduced by 45% since the street was improved in 2021.
- On Hillcroft Avenue from High Star Street to Westward Street, average annual crashes that resulted in injuries reduced by 27% and all average annual crashes reduced by 8% since the street was improved in 2021.
“Houston is committed to Vision Zero and making the City more accessible for people of all modes. The results speak for themselves — our comprehensive approach of safety and multimodal planning is making Houston a safer city,” Mayor Turner said.
Vision Zero-aligned planning, design and outreach are under the guidance of the Transportation Planning Division of the Planning and Development Department. Planning Director Margaret Wallace Brown said that we have a long way to go, but every life saved moves us closer to achieving the only acceptable goal – zero lives lost.
“Vision Zero is a data-driven approach and the data is clear: crashes are coming down, putting us on the path to eliminating fatalities and serious injuries on our roadways by 2030.” Read the full Vision Zero 2022 Annual Report for more statistics, highlights, and ongoing efforts.